The Farsight dataset begins before the initial DMARC standard was first published. This offers an excellent opportunity to study the uses and adoption of the protocol as it matures.
NOTE: This dataset does not cover the entire Internet, therefore none of the graphs below represents Internet-wide figures. They may differ greatly from studies conducted using other datasets. However the trends within this set, the changes over time, are believed to be representative of Internet-wide trends and therefore provide valuable insight.
Adoption
This section shows the number of domains that first published a DMARC policy in a given month, provided they still have a DMARC policy published when this dataset was evaluated. In other words a domain that first published a DMARC policy in January 2016 will be included in the figure for January 2016, provided the domain still had a valid DMARC policy published in January 2021 (for a dataset that covers through the end of 2020, in this example).
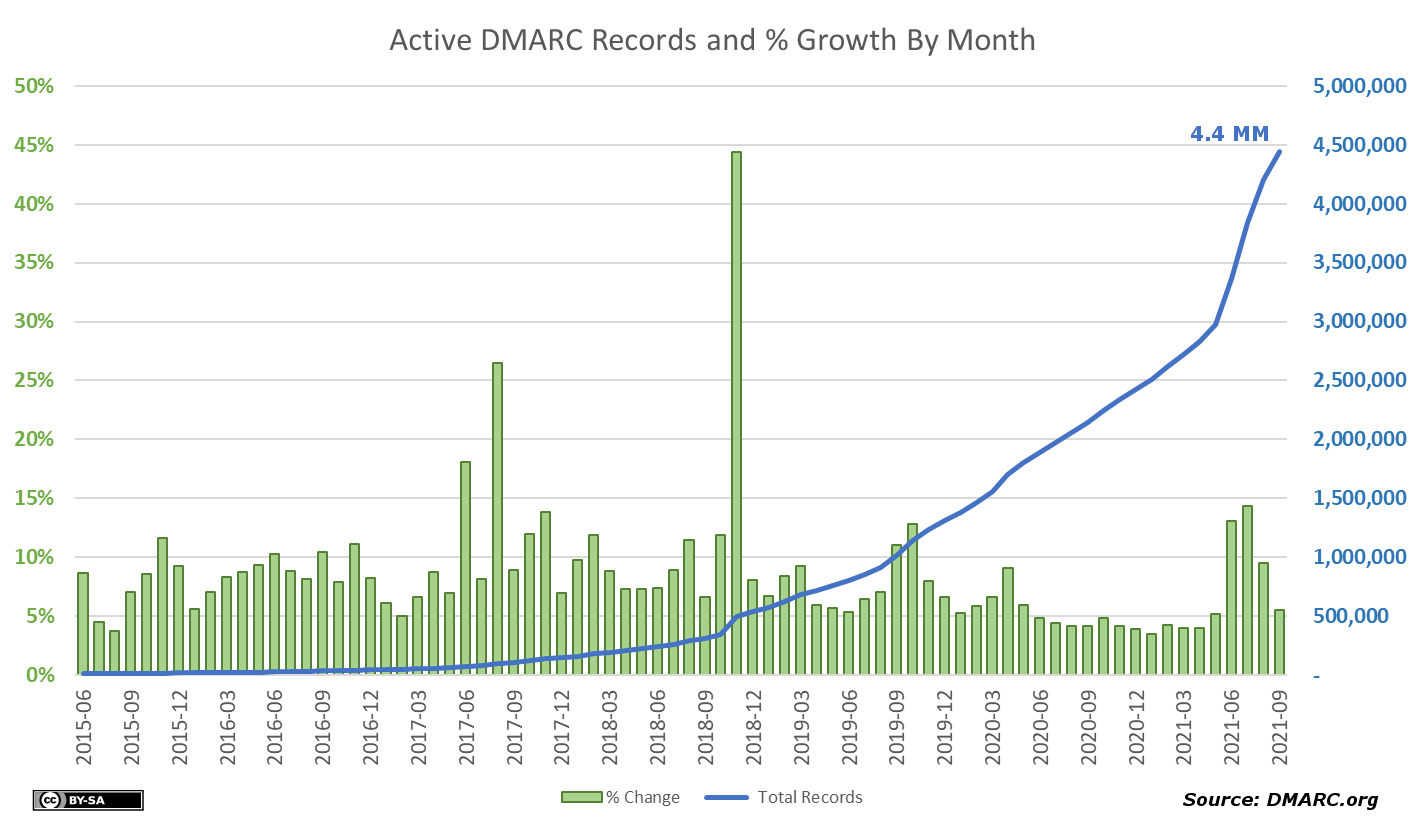
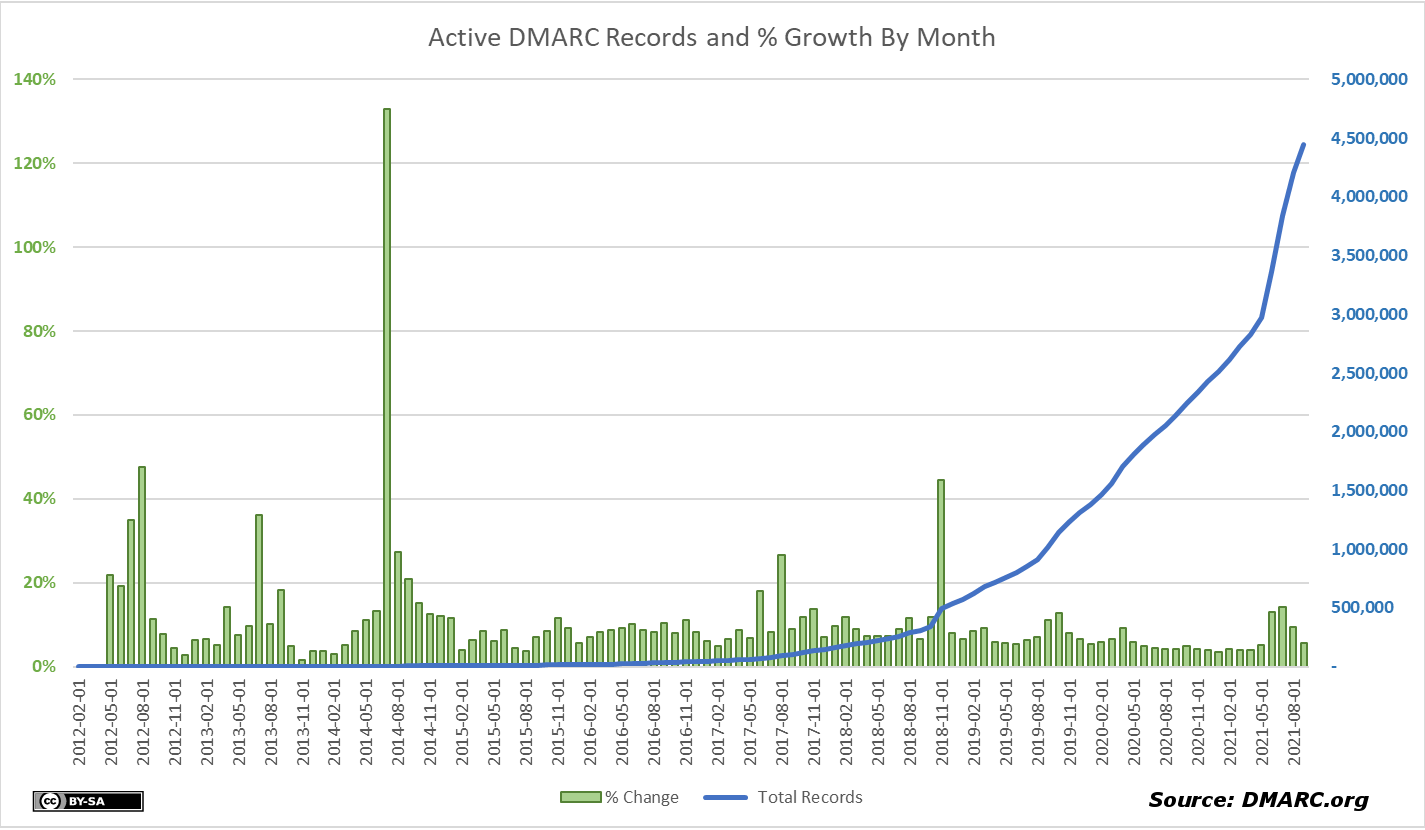
The graph above only shows the data from 2015 through mid-2021, but a similar graph starting in 2012 is available here. In November 2018 there was a surge of 5MM new DMARC records published, most of them at unusual labels like _dmarc.mx.mx.mx.example.com, believed to be from a single hosting organization. Most of those records may have been mistakes as they were no longer published by 2020, but even without them the number of published records increased by nearly 50% in that month.
The following graph covers the same set of domains, but shows the number of valid DMARC records published for the first time in each month. The chart starts in January 2017 because the large scale needed for later months would make the earlier monthly totals invisible.

There is clearly a large increase in new records in June 2021, four times the average number of new records in the preceding 12 months. Referring to the first graph this is only a 13% increase in the total number of active DMARC records at the time, but the surge continued for at least the following two months. It will be interesting to see what the fourth quarter data shows.
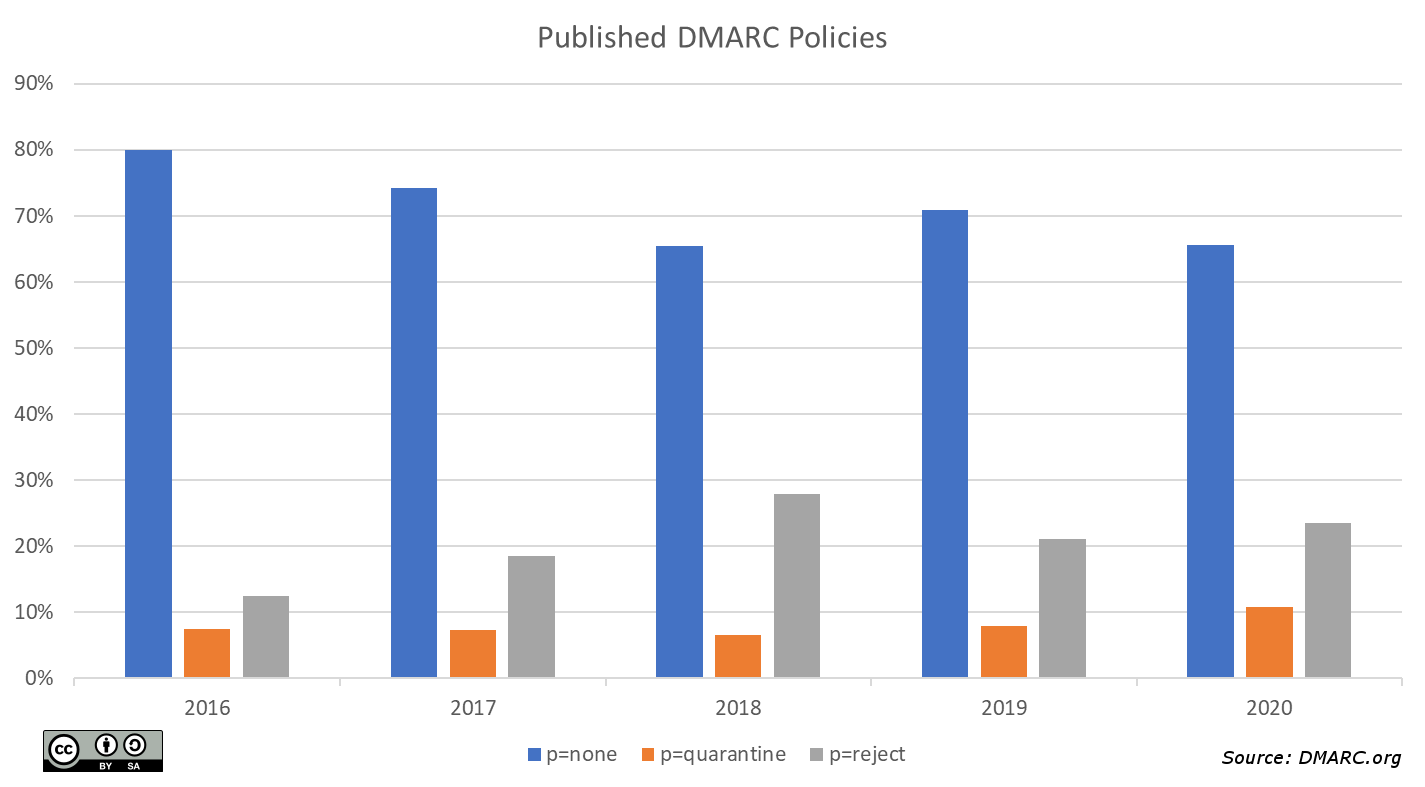
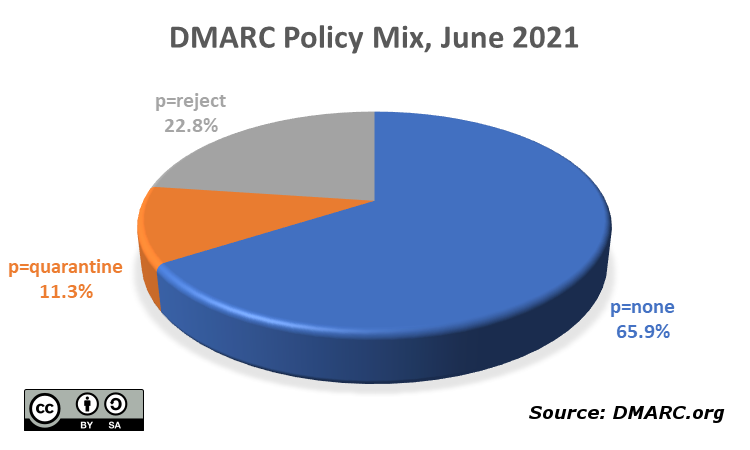
Policies
These graphs try to show the relative proportion of each DMARC policy option among all the active, valid DMARC records in the dataset. First is the overall policy mix at the end of CY2020, followed by a chart of the policy mix as captured every six months over the past several years.
The following graph shows the policies at the end of the past several years. There is a small but gradual decrease in the number of domains publishing a “p=none” policy, with a corresponding increase in the “p=quarantine” and “p=reject” policies.