The figures below are derived from analysis of data generously provided by Domain Tools.
NOTE: This dataset does not cover the entire Internet, therefore none of the graphs below represents Internet-wide figures. They may differ greatly from studies conducted using other datasets. However the trends within this set, the changes over time, are believed to be representative of Internet-wide trends and therefore provide valuable insight.
Adoption
This section shows the number of published DMARC policies, as of when they were first observed in DNS, provided that they still have a DMARC policy published when this dataset was most recently evaluated. In other words a domain that first published a DMARC policy in January 2016 will be included in the total for January 2016, provided that the domain still had a valid DMARC policy published in January 2021 (for a dataset that covers through the end of 2020, in this example).

The graph above only shows the data from 2016 through the middle of 2022, but a similar graph starting in 2012 is available here. In November 2018 there was a surge of 5MM new DMARC records published, most of them at unusual labels like _dmarc.mx.mx.mx.example.com, believed to be from a single hosting organization. Most of those records may have been mistakes as they were no longer published by 2020, but even without them the number of published records increased by nearly 50% in that month.
This graph shows the total of valid DMARC policies as published every six months from the end of 2016 through 2021.

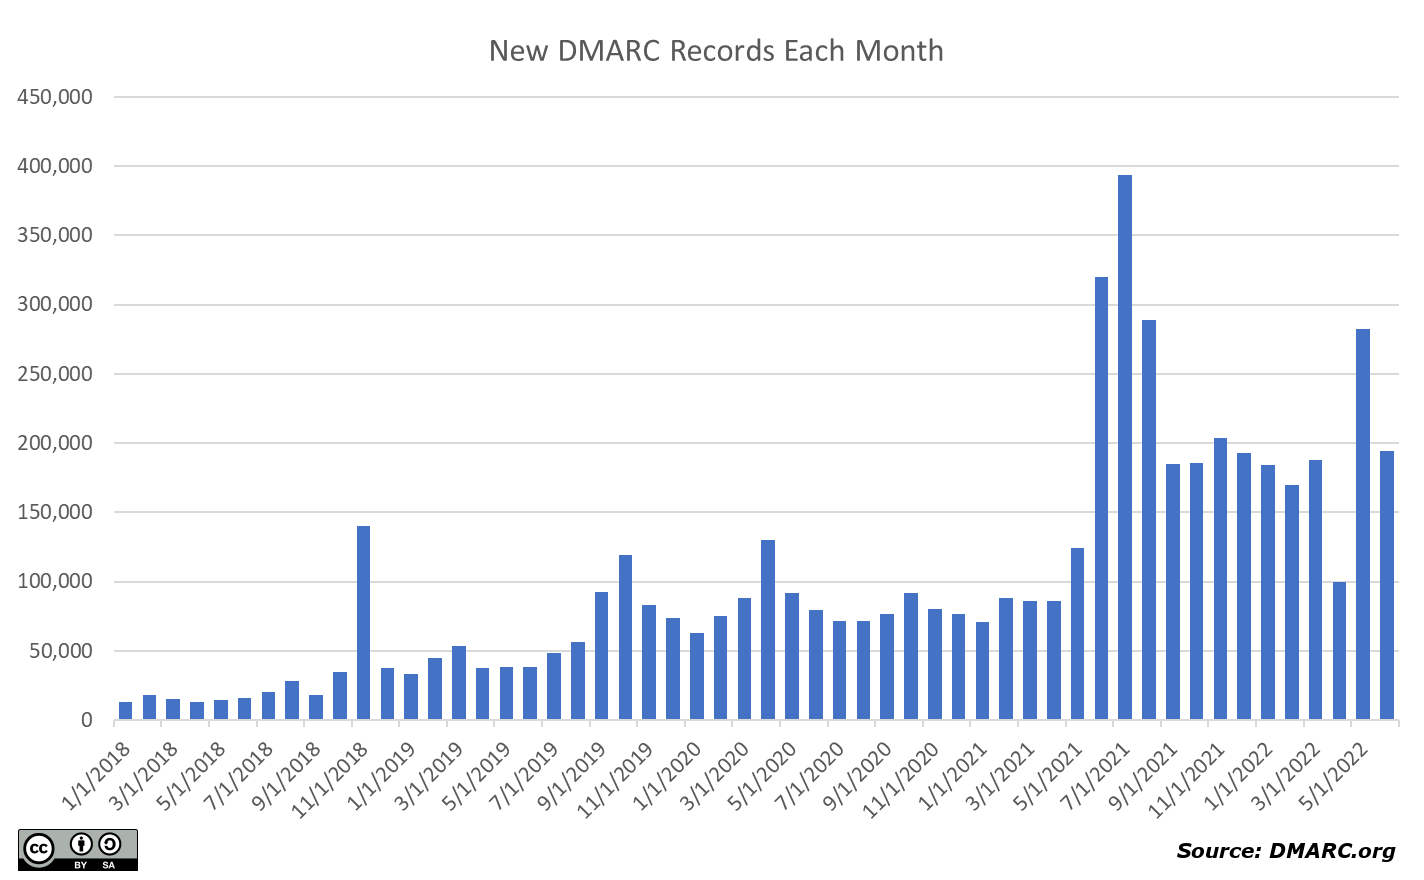
The following graph covers the same set of domains, but shows the number of valid DMARC records published for the first time in each month. The chart starts in January 2018 because the large scale needed for later months would make the earlier monthly totals invisible.
Policies
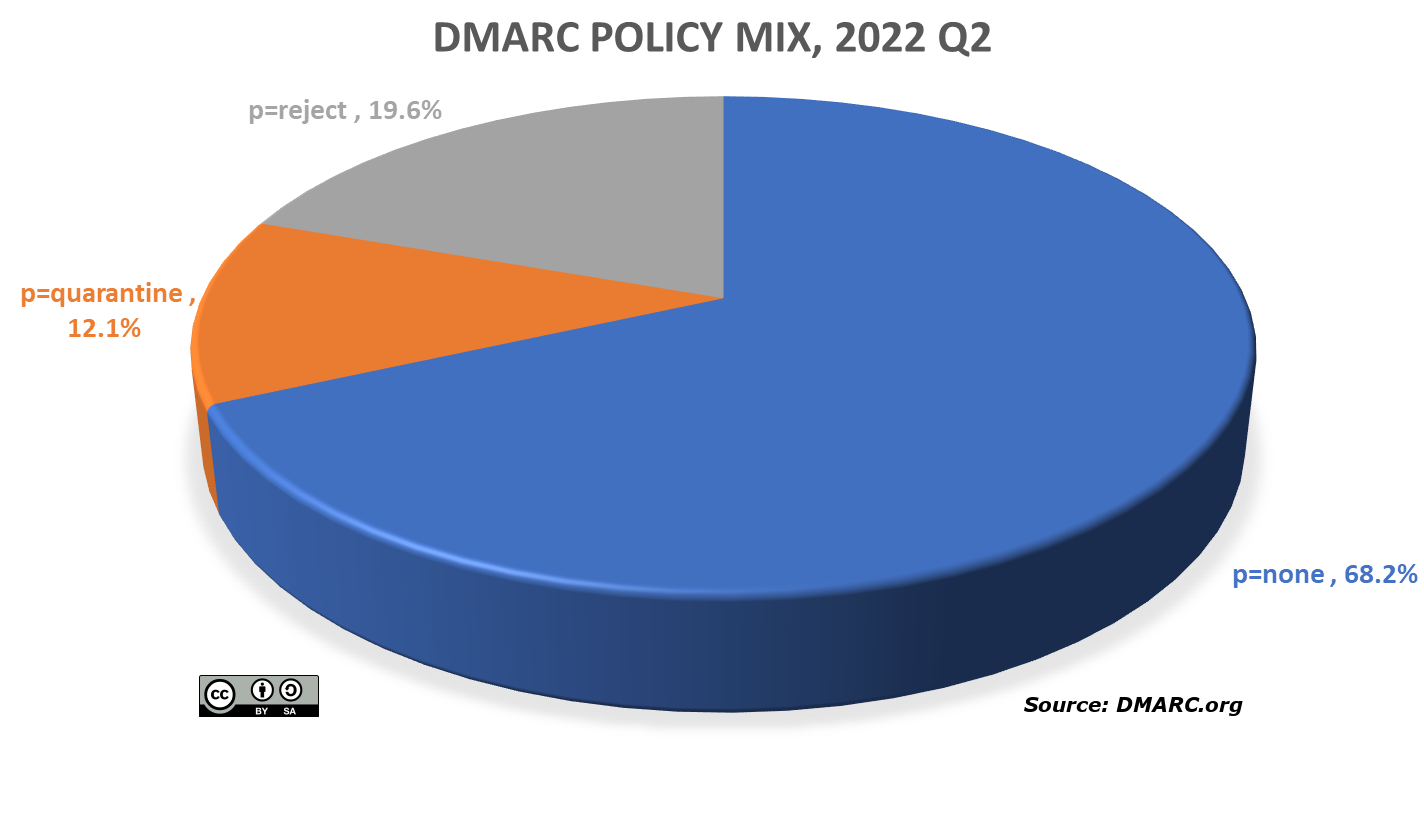
These graphs try to show the relative proportion of each DMARC policy option among all the active, valid DMARC records in the dataset. First is the overall policy mix at the end of CY2021.
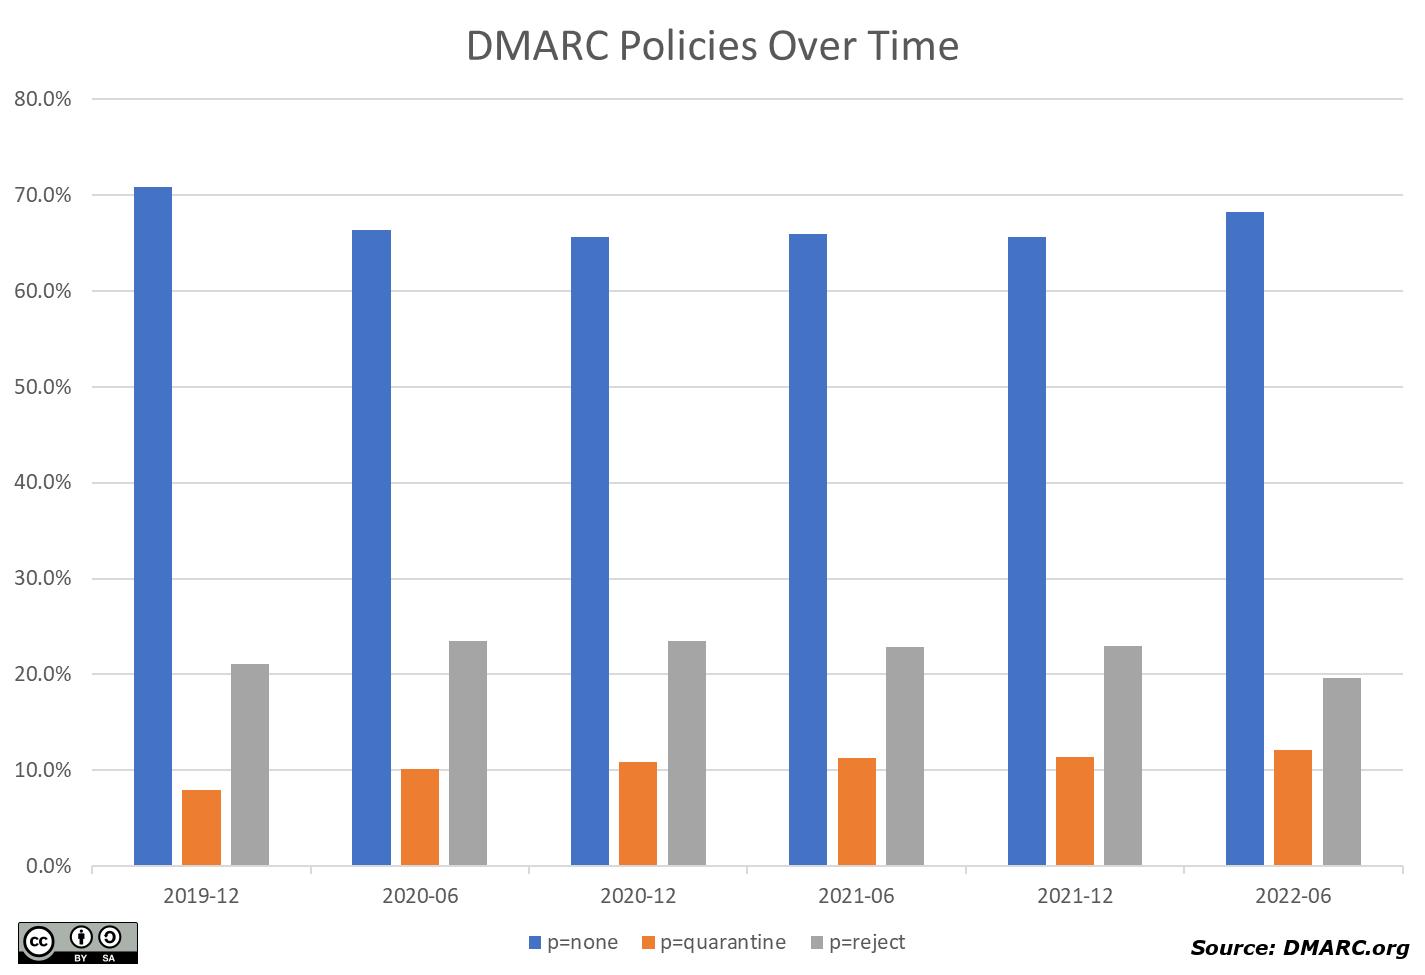
Below is a chart of the policy mix as captured every six months from December 2019 through June 2022.